Multi-Source Data Analytics and Dashboard Integration in Retail
A guide to optimizing KPI tracking in retail businesses by consolidating fragmented sales and stock data into executive dashboards.
Introduction and Scope
For retail businesses in Turkey and the TRNC, collecting data from various physical stores, warehouse systems, and e-commerce channels into a single center is a critical operational step. This fragmented data makes it difficult for decision-makers to see the real-time situation. This technical guide covers integration processes in a multi-source structure.
Fundamentals of Multi-Source Data Integration
To establish a correct structure in the retail sector, sources must first be identified. Physical cash register data, ERP systems, warehouse movements, and online order infrastructures generate data in different formats. At this point, Data Analytics & Reporting solutions offered within the scope ensure that information coming from different points is brought together in a common data model.
Ensuring Data Flow
- Collection of raw data coming from various channels.
- Resolution of format incompatibilities and standardization.
- Transfer to the central database via secure protocols.
Process of Merging Sales and Stock Data
Simultaneous monitoring of sales figures and stock levels directly affects supply chain costs. To see which product is selling out fast in which store, Data Analytics & Reporting tools must be used to conduct in-depth analyses. This consolidation process plays a fundamental role in preventing risks such as overstocking or stockouts.
Executive Dashboard Design and KPI Tracking
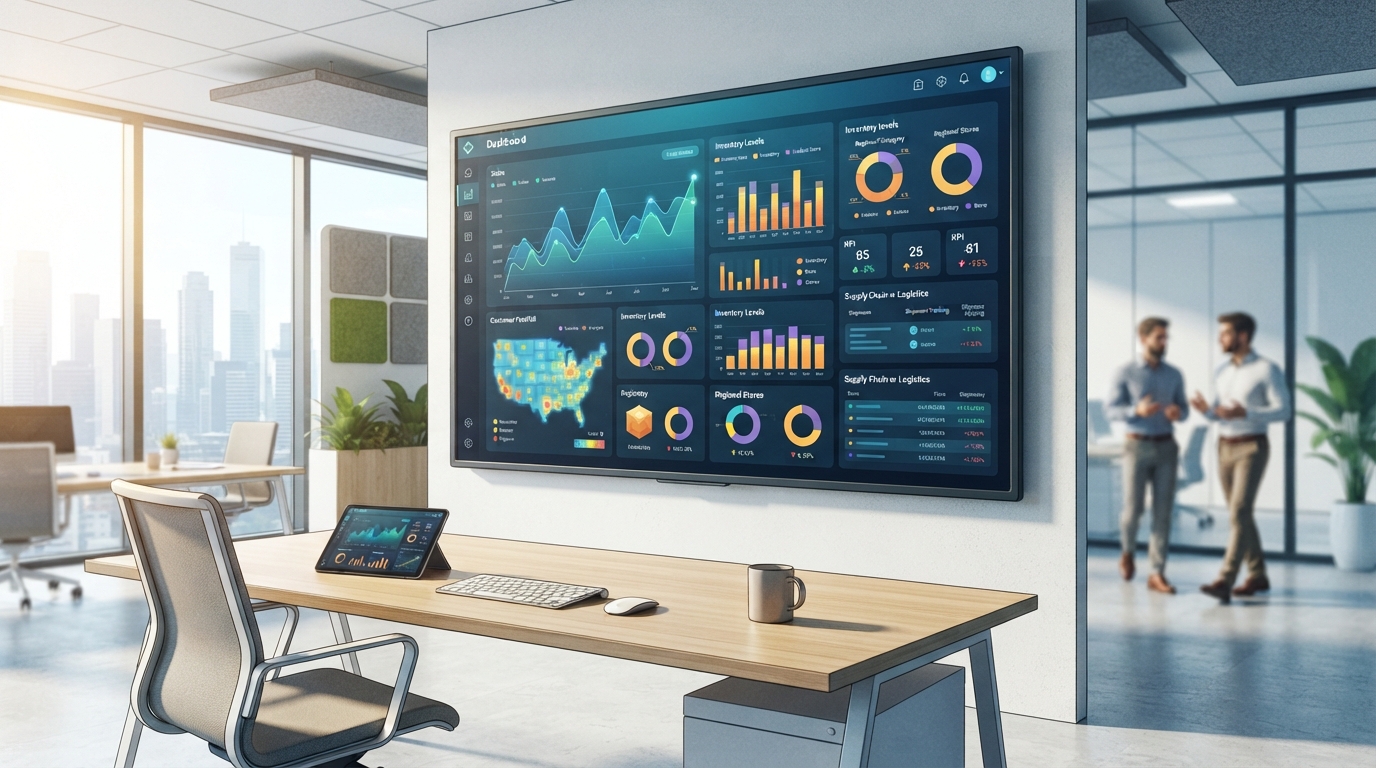
For senior management to make strategic decisions quickly, a simple and functional interface is needed instead of complex tables. Executive dashboard structures bring the business's critical indicators to a single screen. Data Analytics & Reporting infrastructure, retail reporting processes are automated, and Data Analytics & Reporting KPI tracking is performed in accordance with standards.
Key Indicators to Monitor
- Daily and periodic turnover changes.
- Store and channel-based inventory turnover rates.
- Product-based profitability ratios.
Conclusion
Increasing operational efficiency and making accurate decisions in the retail sector depend on gathering fragmented data under one roof. Data Analytics & Reporting solutions allow businesses to manage [data integration], [data analytics], and [executive dashboard] processes most effectively.
Hypothetical Scenario: A Multi-Channel Chain Store Application
In this scenario, let's consider a fictitious retail brand with twenty physical branches across Turkey and an active e-commerce site. The brand was struggling to match instant receipt data from physical registers with online store order logs. Due to delayed stock updates, a product sold out in e-commerce would appear available in the physical store, or vice versa, leading to operational disruptions. To solve this chaos, Data Analytics & Reporting infrastructure was deployed. The biggest technical trade-off encountered throughout the process was striking the balance between the load of real-time data flow on the database and reporting speed. While real-time synchronization caused cost increases, bulk data pulling operations led to delays. This dilemma was overcome with a hybrid queue management architecture. On the error management side, a mechanism was designed to store data in the local cache in case source systems disconnect and transmit it to the center when connectivity is reestablished. Thus, data loss during potential network outages was prevented.
Implementation Checklist
To successfully complete and commission multi-source data analytics and dashboard projects, the following steps must be meticulously followed:
- Inventorying all physical cash register, ERP, and e-commerce API endpoints.
- Resolving data dictionary and field mismatches between source systems.
- Configuring SSL/TLS protocols and authorization layers for secure data transfer.
- Data Analytics & Reporting Creating a common data model in compliance with standards.
- Determining KPIs to be displayed on executive dashboard screens with senior management approval.
- Establishing automatic error-catching and logging mechanisms against potential disconnections in data flow.
- Testing system performance and performing user acceptance tests.
Sources
- Data Analytics & Reporting — Cy Logic Software